
RadioHound: A Low-Cost Spectrum Sensor
Principal Investigator: Professor Hochwald
AWaRE REU Researcher: Chloe Crusan, Bethel College
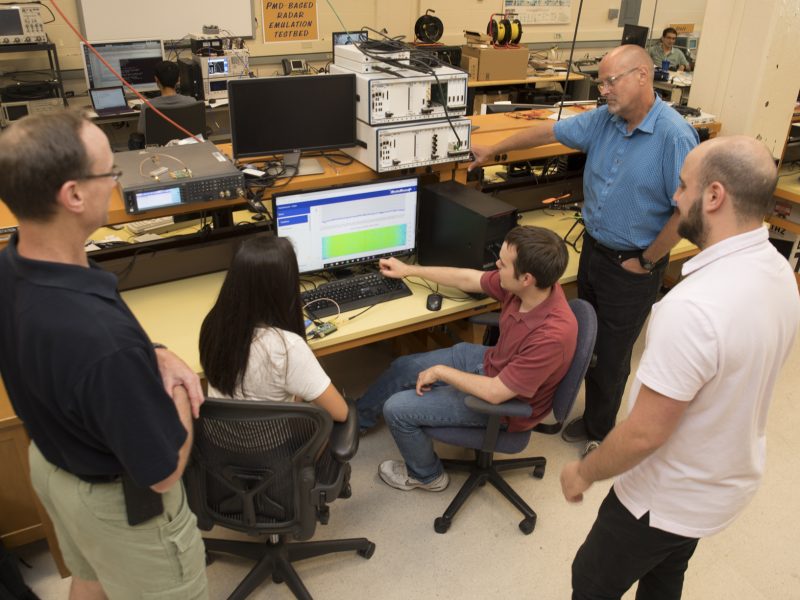
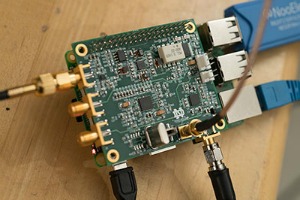
Project Description: RadioHound, an ongoing project at Notre Dame Wireless Institute, is the development of low-cost, portable spectrum measurement sensors capable of tuning over a wide range of frequencies commonly used by everything from cellular phones to wireless local area networks, to radios and televisions. One goal is to distribute these sensors over a wide geographical area and thereby crowd-source the real-time measurements to create a “heat-map” of spectrum usage over the area and across frequency. Such a map would be used, for example, to determine where spectrum congestion is dense. We are in the third year of this project.
The project has many hardware and software components and opportunities for students to contribute, depending on their technical software and hardware maturities and skillsets. Basic hardware and laboratory capabilities, and knowledge of C, Python, and networking are a plus, but not required.
In particular, we have openings for two opportunities: (1) laboratory measurement help with the experimental verification of heat-maps that are generated by these sensors. Hence, knowledge of laboratory equipment and practices is advantageous; (2) web-application software development to help with displaying and controlling various aspects of the RadioHound system. Hence, knowledge of web development is advantageous.
Finding: Spectrum mapping is a form of signal processing that creates a visual representation of the presence of a signal across a geographical region. The U.S. Army, Google, and Amazon have a use for the graphical data our sensors can provide. Mapping can be used to track walkie-talkie usage or to map which frequencies are being used for Wi-Fi, TV, radio, or personal communication. When computing the spectral density estimation by way of the Fast Fourier transform (FFT), the signal in the time domain transforms to the frequency domain. After transformation, there is an issue with proper scaling of amplitudes to the final graph. To rectify this, I used applied mathematics of the Welch periodogram method to correct for the amplitude.